XY Plotter
XY Plotter
I built this application last year (2020). This was my first attempt using Chart.js
The idea
Chart.js is an open-source JavaScript library that makes it easy to produce charts on a webpage. To implement Chart.js however, requires that the user understand 1) HTML (to build the frame of their webpage) and 2) understand JavaScript (to implement Chart.js functions). For my project, XY Plotter, I decided to simplify the learning curve of Chart.js and created a webpage that allows users to build Chart.js scatter plots. I chose the scatter plot features of Chart.js because scatter plots are commonly used to demonstrate relationships between two variables, X and Y. For more information on scatter plots, here is a nice summary put together by ChartIO Data Tutorials : A Complete Guide to Scatter Plots.
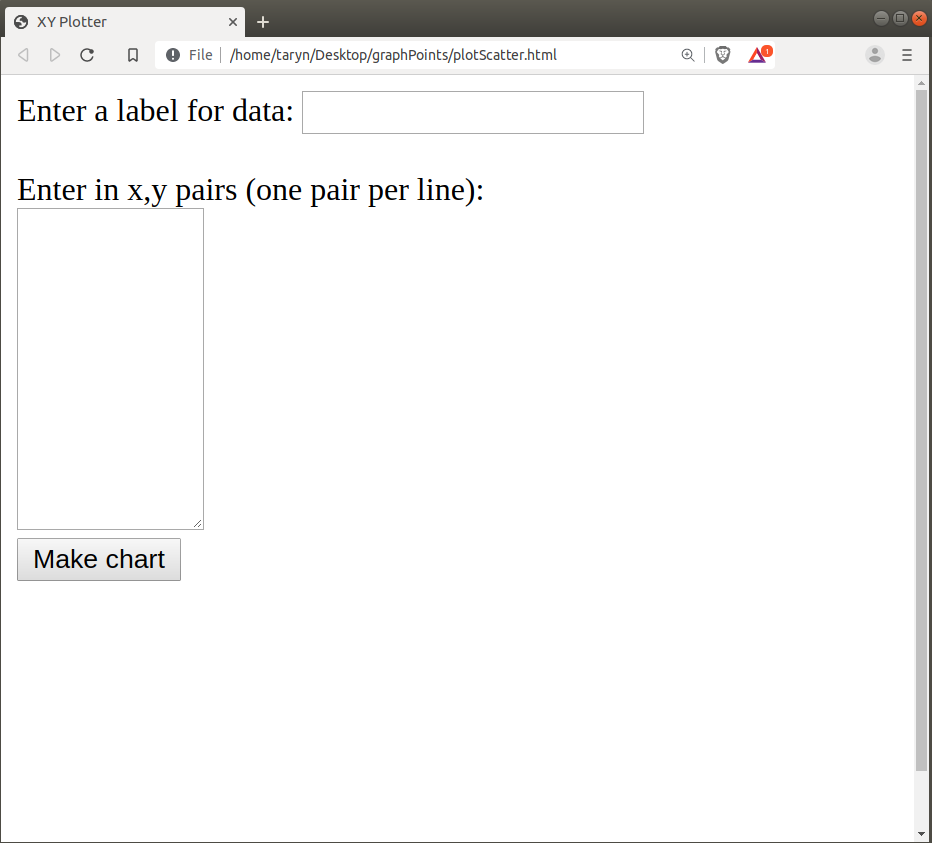
With my webpage interface, a user can simply enter in XY pairs and click on “Make chart” to make a nice scatter plot. The user also has the option of labelling their data. Here is a screenshot of XY Plotter (sans data) (See Figure 1).
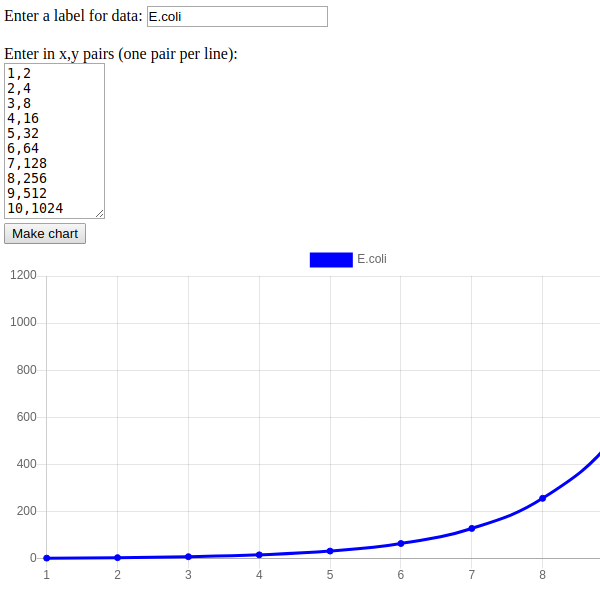
Here is a screenshot of XY Plotter with some data points. Note that users must enter each data point with X and Y values separated by a comma (e.g. X,Y). (See Figure 2).

For more information on bacterial growth, see Todar’s Growth of Bacterial Populations.
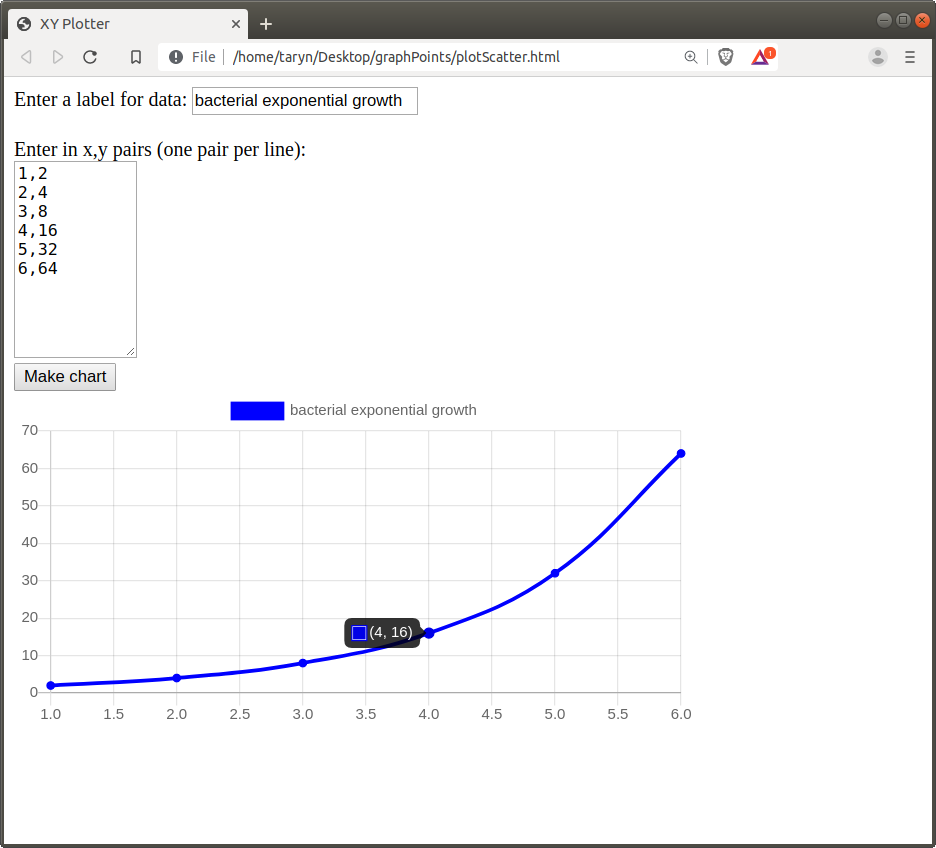
The default setting for Chart.js scatter plots is for onHover() to be on. This gives the scatter plot more interactivity with the user and this feature can be useful in demonstrations (i.e. when pointing out a specific data point) (See Figure 3).
Programmers can also download my code (See links to code below) and use XY Plotter as a base webpage, adding additional Chart.js features (e.g. X and Y labels). In this way, XY Plotter can be a starting point for building more complex graphing interfaces fitting user-specific needs.
The program
You can run XYPlotter here. You can also find the code to this program in my Projects - XYPlotter folder or run it yourself in JFiddle
In order to implement Chart.js, the following line must be added to the HTML document:
<script src="https://cdn.jsdelivr.net/npm/chart.js@2.8.0"></script>
The rest of the JavaScript code is in the following <script> element:
<script type="text/javascript">
            document.addEventListener('DOMContentLoaded',init);
            //this function will clear all of the children of an element
            function removeChildren(elem){
                while(elem.childNodes.length > 0){
                    elem.removeChild(elem.childNodes[0]);
                }
            }
            //this function obtains the user input data and
            //calls the doChart() function to make the chart
            function getDataAndPlot() {
                let data1 = [];
                const label = document.getElementById("label");
                let label1 = label.value.trim();
                const myChart = document.getElementById("myChart");
                removeChildren(myChart);
                const textarea = document.getElementById("textarea");
                let xydata = textarea.value.split("\n");
                //console.log(xydata);
                for (let i = 0; i < xydata.length; i++) {
                    let splitValue = xydata[i].split(",");
                    let row = {};
                    row["x"] = Number(splitValue[0]);
                    row["y"] = Number(splitValue[1]);
                    data1.push(row);
                }
                //console.log(data1);
                doChart(data1,label1);
            }
            function init() {
                const run = document.getElementById("run");
                run.addEventListener("click",getDataAndPlot);
            }
            //this doChart() function uses Chart.js to create a
            //xy scatter chart
            function doChart(data1,label1) {
                let ctx = document.getElementById("myChart").getContext('2d');
                let chart = new Chart(ctx, {
                    type: 'scatter',
                    data: {
                        datasets: [{
                            label: label1,
                            backgroundColor: 'blue',
                            borderColor: 'blue',
                            data: data1,
                            fill: false,
                            showLine: true
                        }]
                    },
                    options: {}
                });
            }
        </script>
We can breakdown the code as follows. The first line causes the init() function to be called when the DOM Content has finished loading. This means that after all of the HTML markup in the <body> is rendered, init() is called.
document.addEventListener('DOMContentLoaded',init);
The init() function gets a reference to the button with id=”run” and makes it so that clicking on that button causes the getDataAndPlot() function to be called.
function init() {
   const run = document.getElementById("run");
   run.addEventListener("click",getDataAndPlot);
}
The getDataAndPlot() function is used to create the data that Chart.js is going to plot.It obtains the data from input type=”text” and the textarea to make the chart. The data from the textarea is split on a \n and a for() loop iterates over the data to create the array of data that will be plotted. This function calls the removeChildren() function to clear out the previous chart.
function getDataAndPlot() {
   let data1 = [];
   const label = document.getElementById("label");
   let label1 = label.value.trim();
   const myChart = document.getElementById("myChart");
   removeChildren(myChart);
   const textarea = document.getElementById("textarea");
   let xydata = textarea.value.split("\n");
   //console.log(xydata);
   for (let i = 0; i < xydata.length; i++) {
        let splitValue = xydata[i].split(",");
        let row = {};
        row["x"] = Number(splitValue[0]);
        row["y"] = Number(splitValue[1]);
        data1.push(row);
   }
   //console.log(data1);
   doChart(data1,label1);
}
The removeChildren() function will remove all the children from any HTML container element. It is called from getDataAndPlot() to clear out any previous chart.
The doChart() function is what actually creates the plot using the Chart.js library. The type is set to ‘scatter’ to create an XY scatter plot.
function doChart(data1,label1) {
   let ctx = document.getElementById("myChart").getContext('2d');
   let chart = new Chart(ctx, {
       type: 'scatter',
       data: {
           datasets: [{
              label: label1,
              backgroundColor: 'blue',
              borderColor: 'blue',
              data: data1,
              fill: false,
              showLine: true
            }]
       },
       options: {}
   });
}
Conclusion
XYPlotter is a useful tool that non-programmers can use to build simple XY scatterplots. Programmers, even the beginning programmer, can take this tool and implement Chart.js functions directly for their specific needs.